
What is a recommender system?
A recommender system is an incredibly powerful tool — It’s how Netflix decides which videos to suggest, how Amazon decides the next thing they think you want to buy, and how Spotify tries to get new music on your playlist.
Types of recommender systems
While there are a many different varieties of recommender system, most tend to operate on the basis of one or both of two basic approaches:
Collaborative filtering: This is a “people who liked X also liked Y” system. It looks at the content you’ve interacted with (viewed, liked, bought, etc.), and then looks at people who interacted with many of those same things, and then looks at what other things those other people liked. Those other things are what the system recommends to you.
Content-based filtering: This is a “people who liked X will also like Y because of Z” system. It looks at attributes of the content you liked - if it’s videos, then maybe the attribute is genre or director; or if it’s food, then maybe the attribute is cuisine or ingredient. It then recommends other items that have those same attributes.
But, no matter which method they use, both collaborative filtering and content-based suffer from what is known as, “the cold-start problem” — The recommender system wants to suggest content so you’ll interact with the content, but the only way it can know what to recommend is if you…interact with content.
Recommender systems have a hard time getting off the ground because users need to already be somewhat active for the system to get a read on them.
Cold-Start isn’t the only problem
At Aampe, we initially set out to find a solution to the cold-start problem, but we ended up also fixing a more important issue along the way: the problem of a recommender system being inherently a popularity contest.
Collaborative filtering runs the contest among people who consumed the same content you have, and content-based filtering runs the contest among items that share attributes with content you’ve consumed in the past, but it’s still just a matter of picking the most popular item.
And underlying all of that is the assumption that more popular items have a higher chance of converting (e.g. If I give you something everyone likes, there’s a higher chance that you’re going to try it and like it, too).
What if it doesn’t work that way?
The initial problem we faced was that our customers wanted to message a bunch of users who hadn’t done much in our customers’ apps (That was, in fact, a large part of the reason they wanted to message them — to entice them to come on the app and try it out and hopefully find something that would make them return again and again). This was a whole big group of people for whom the collaborative-filtering recommender we already use couldn’t work, because there was no historical behavior to feed into it.
Thankfully, because Aampe sits on top of an app’s events stream, we had loads of data to work with to build our way out of the cold-start problem, and we arrived at a powerful solution: recommend items that tend to convert more when viewed.
For example, when we looked at around a month of app activity for one of our larger e-commerce customers, we saw nearly 900,000 users across three different countries. Those users viewed nearly 1.2 million unique items in a month’s time. Many of those users did more than view — we looked at the 24 hours after a user viewed an item and recorded how much, if anything, they actually bought.
That’s when we noticed something interesting —
The items most often viewed weren’t the items most often followed by a purchase.
It’s common sense, of course: just because a lot of people look at an item doesn’t mean a lot of people buy the item. In fact, we saw over and over again items which seemed to go viral in the system, garnering tons of views, but then failed to lead to purchases.
Now, we could have focused only on items that were purchased a lot, but (1) that’s a much smaller number, so it doesn’t do as much to solve our cold-start problem, and (2) just because a lot of people buy an item doesn’t mean a lot of people will buy that same item if you message them about it.
We needed to model that connection betweens views and purchases.
Conversion-based recommendations: A high-level overview
We won’t go into detail here about the model we used (We did that over here). This is just a 10,000-foot view:
First, we rolled all of that app event data up into a dataset where, if it had been a really big spreadsheet, each user would have been a row and each item would have been a column.
Then we trained a model to predict whether a user bought something within 24 hours of viewing an item (The more an individual user had bought many things after viewing a few items or had viewed lots of items but bought consistently after almost every one, the more we made the model pay attention to those users and learn more from them than, say, the user who viewed 30 different things and bought only once.
There are a number of ways to evaluate a classification model, but perhaps the easiest way to talk about it is in terms of a “confusion matrix”:
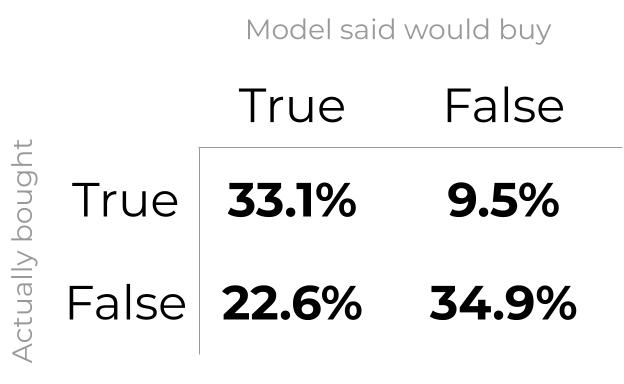
As the matrix shows, about 33% of the users who actually bought were users who the model predicted would buy, and about 35% of the users who didn’t buy were users who the model said would not buy. So overall, the model’s accuracy was around 68%. However, the important details are in where the model got it wrong:
22% of the users bought, but the model thought they wouldn’t.
Only 9.5% of the users didn’t buy even though the model said they would.
In other words, the model got it right a lot of the time, and, when it did get it wrong, it tended to think people wouldn’t buy when they actually did.
Of all the users it said would buy, 79% actually did (this is sometimes referred to as a model’s “precision”).
All that is good, but we didn’t build this model to predict a user’s propensity to buy (we have other models that do that). What we want is an estimate of each individual item’s propensity to influence a user to buy.
Item-level predictions feed our recommender
The wonderful thing about models is that you can feed them scenarios you might not have actually observed in your historical data, and if that historical data is rich enough, the model will still tell you something about what you want to know.
We created a new dataset of fake users, where each user looked at one and only one item from the 1.2 million items we might want to recommend, and the model then output a probability estimate — the chances that each “user” would purchase given they viewed only that one item.
Here’s the distribution of those scores, separated into a separate line for each of the three countries the items covered:
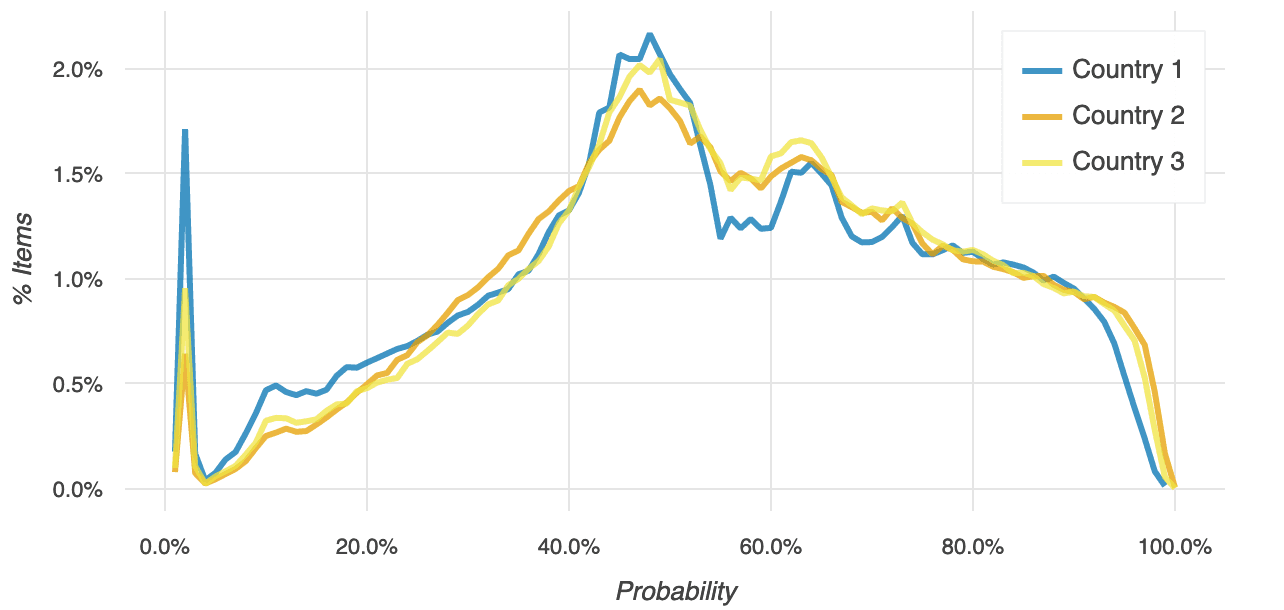
There’s a big spike on the far left of the plot. That’s a big cluster of items that had generally extremely low scores.
Then the number of items builds the closer we get to a probability of 0.5 (at which point an item has a 50/50 chance of influencing a user).
And then we see a slowly decreasing number of items leading up to a probability of 1.0.
For each of these three countries, we identified between 12,000 and 25,000 individual items that had a 90% or greater chance of influencing a purchase. That gives our recommender more than enough items to suggest to users, even if they’ve never done anything on the app before. And because these scores are model-based, we can refresh our item list, and the scores attached to those items, as often as we want.
Popularity and influence are not the same thing
Earlier, we mentioned that we noticed that the items most likely to influence a purchase were not the same items that were most often viewed. Here’s what that looks like:
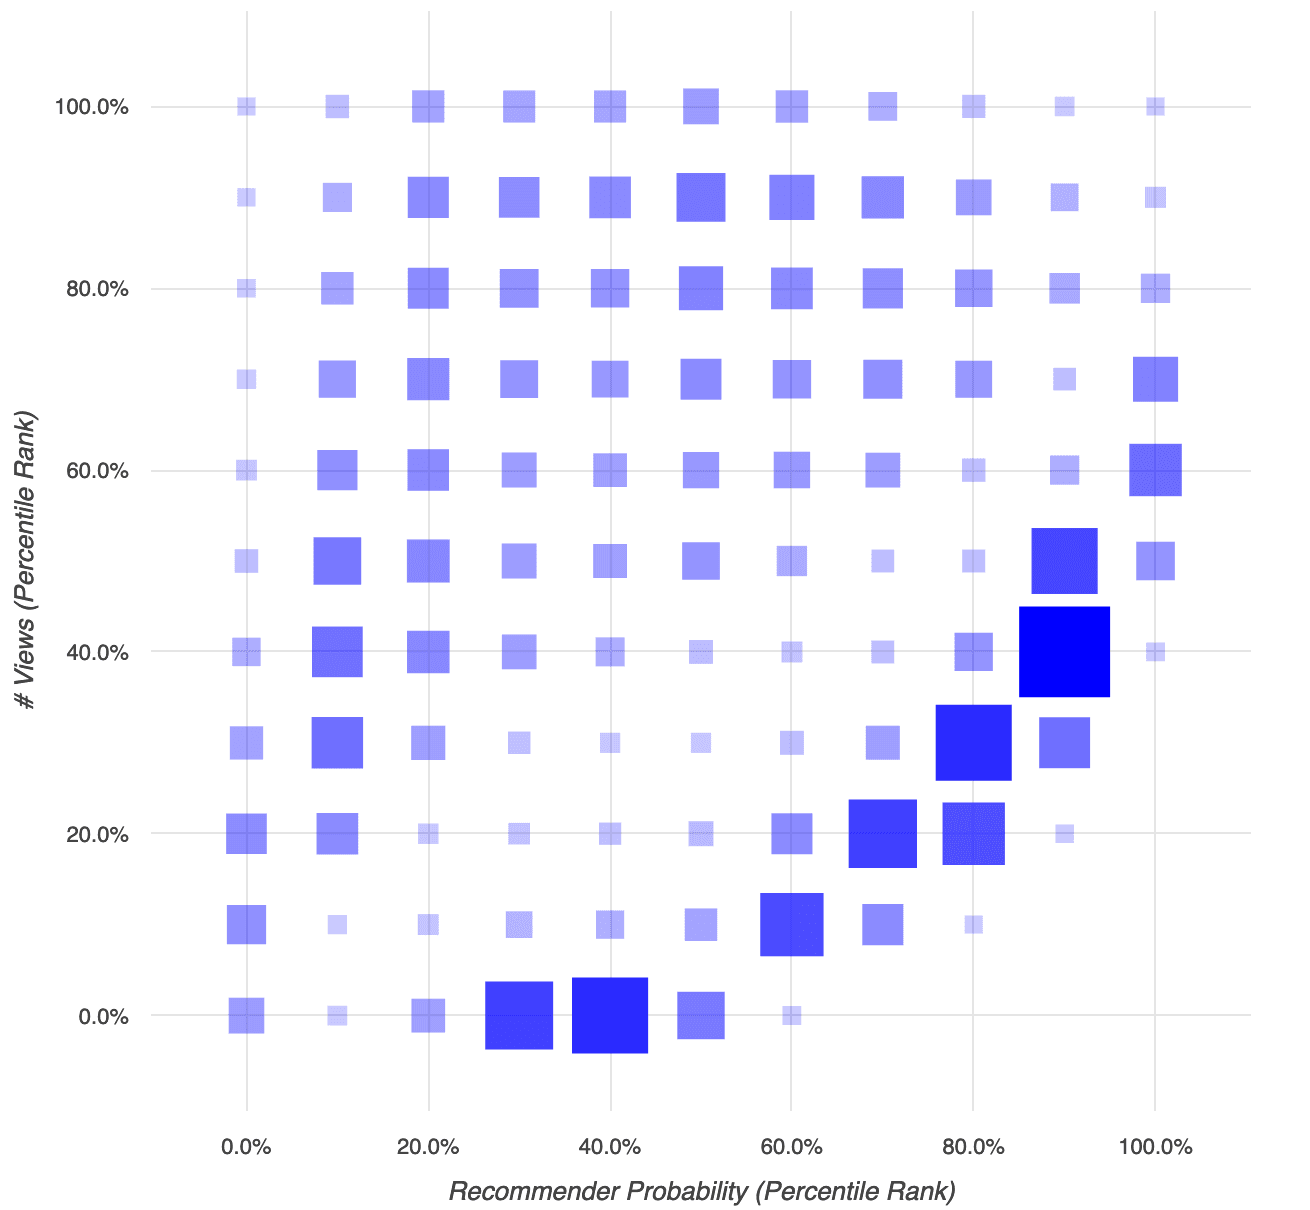
The horizontal axis shows the items’ probability of conversion as determined by the recommender. The vertical axis shows the number of views an item had. In both cases, we converted the measures to percentile ranks so we wouldn’t be thrown off by differences in the underlying distribution (as you saw in the earlier section, the probabilities are shaped like a sort of bell curve, whereas item view counts tend to have a whole lot of pretty small value and few really large values — not a bell-shaped distribution at all). The size of each square in this plot represents how many items fell into that combination of probability and item views.
There are two main patterns here:
The dark swoosh of squares rising from the bottom middle to the right shows that the majority of items had anywhere from a very low view count but a moderate probability, to a moderate view count and quite a high probability. That’s a mildly positive correlation, but far from definite.
The other pattern makes up the top-left triangle of the graph - a whole lot of items that had quite high view counts but quite low probabilities.
[If you prefer a correlation coefficient: Kendall’s tau, which handles this kind of rank-ordered correlation well, came in at around 7%. That’s…not a lot. If we looked at the number of unique users who viewed instead of total views, the correlation rose to…8%. It’s not that item popularity is negatively associated with power to influence. It’s that there’s just not much of a relationship at all.]
Aampe knows what makes users convert
At Aampe, we’re not focused purely on vanity metrics like item views or popularity. As we’ve demonstrated, we’ve built our system to understand which content leads to actual conversions and we optimize for that.
Now, it doesn’t matter if your user has never done anything but actually download your app - when you’re using the Aampe recommender, you can start sending engaging, converting recommendations from day one.
Want to see how Aampe can help your app increase conversions? Drop us a line at hello@Aampe.com


